Seasonality is a characteristic of price data which exhibits consistent and predictable movement that recurs every calendar year. The price movement of any asset may trade in a certain direction or with similar magnitude during the same time period each year. These repeated price movements are classified as seasonality or seasonal effects and traders and investors look to capitalize on these data patterns.
Some common seasonal effects may be the retail sector trading higher heading into the anticipated holiday sales numbers or the energy sector trading lower after the demand for energy fades coming out of the winter months. These seasonal effects appear year after year and become visually obvious when analyzing the data. More importantly, they are often intuitive and have sound logical backing.
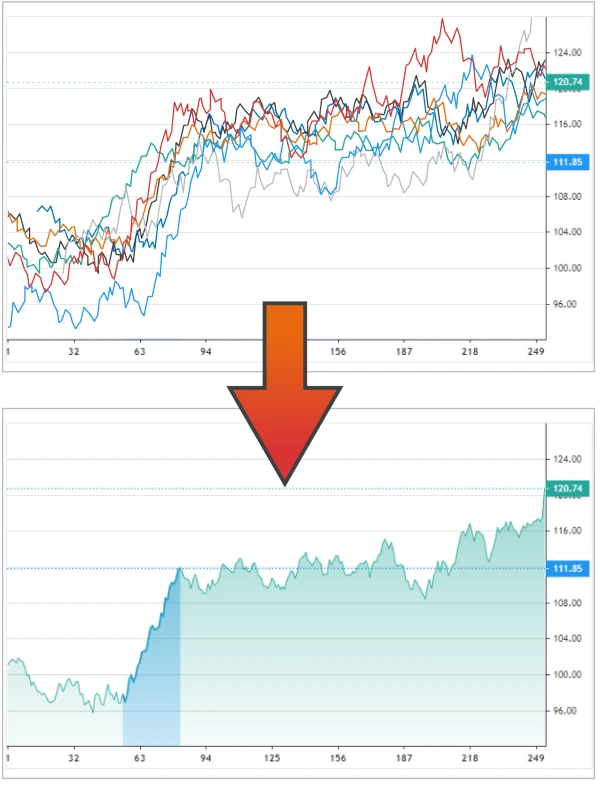
In short, seasonality is a repeatable pattern that recurs each year. We can visualize this by looking at the example of one stock below. On the top graph, each line is a different year moving from January to the end of the year. As we combine each year’s data, we start to see the seasonality this stock exhibits from about the 60th trading day of the year (about the end of March) to about the 80th trading day of the year (about the end of April). This particular stock shows about an average return of 15% over these 20 trading days. Pretty cool considering the SP500 stock market returns about 7-8% per year on average while having your capital exposed for the entire year.
How to trade Seasonality?
We have scanned hundreds of thousands of data points in order to aggregate decades of historical financial data to simplify every tradeable asset’s price action. We have found that seasonality patterns and seasonal trading can work across all asset classes including stocks, ETFs, futures, foreign currencies and even crypto currencies.
The astute trader has incredible opportunity to quickly sift through data, find opportune moments and optimize capital allocations based on seasonal patterns. If timing is everything, then seasonality is what you are looking for.
We cannot make guarantees about future performance, but we like to focus on analogies in other industries. For example, if traffic at a main intersection gets crowded at the same time each day then it is wise to navigate a route around that potential congestion. Does this mean that traffic will be bad at this time tomorrow? Not necessarily. However, does that mean we should avoid optimizing our route to avoid this traffic light at the crowded time? Of course not. We should still do our best to avoid it. How about a baseball hitter that always hits the ball toward left-field? Now many defenses shift their fielders toward the left to account for this tendency. Does this mean the hitter will not hit the ball to right field? No, but over the course of many at bats the defense is confident shifting their fielders will earn them more outs than hits given up. This is how seasonal trading should be applied to the markets. If a stock performs poorly over a certain time period, then perhaps it can be avoided. Alternatively, maybe a stock does well over a certain period and can be taken advantage of it. Does that mean seasonal trading works every time? No, of course not. However, it does not mean we should avoid the data and information available. If we have a long enough time horizon then we hop to capture more winning trades than losing trades, not unsimilar to the baseball team’s defense.
What is Seasonal Trading?
Seasonal trading is analyzing historical data to find the seasonal patterns and buy shares before favorable periods and exit the same shares as the favorable period comes to an end. The Seasonal Trading application (free trial available) averages all data to show the average movement of every asset from beginning of the year to the end of the year. Let’s look at GLD, the Exchange Traded Fund from iShares that tracks the gold market.
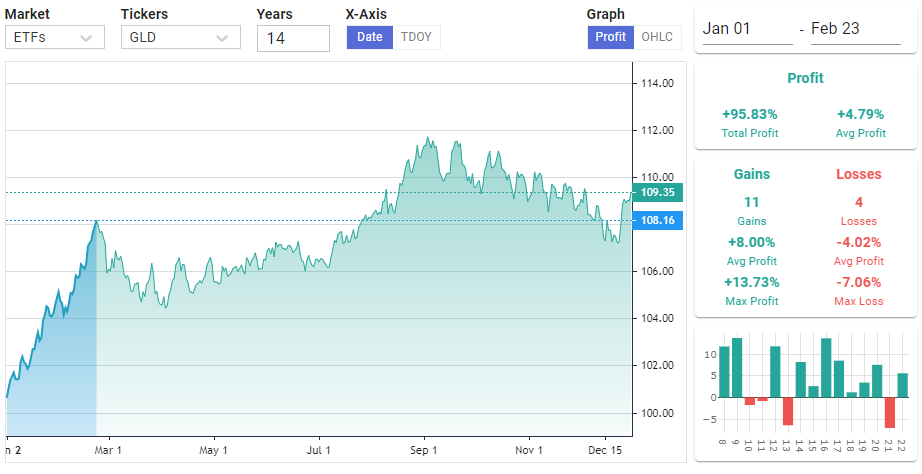
We can see a strong historical seasonal trend starting in the beginning of the year and lasting to about February 23. Simply investing in GLD during this part of the year has earned money 11 of the last 15 years including a total return of nearly 100.0% on invested capital. That is impressive as your capital was only invested for about 14% of the year and could have been doing something else from February 23 to December 31. That is, maybe there is another investment during the other remaining 216 trading days of the 252-trading day year. Take a crack at finding your own using our Free Trial: Pricing – Seasonal Trading
What is Swing Trading? How do Seasonals Help?
Investopedia defines swing trading as a style of trading that attempts to capture short- to medium-term gains in a stock (or any financial instrument) over a period of a few days to several weeks. Swing traders primarily use technical analysis to look for trading opportunities. Swing Trading Definition (investopedia.com)
Seasonal trading can assist swing traders by providing data to validate market timing. That is, a trader may use a swing trading technique such as indicators or other factors and combine that with seasonal analysis. If the two techniques are in agreement, then the trader may proceed. However, if the swing trading entry conditions and the seasonal pattern disagree then perhaps the trader should have a second think.
Seasonal Swing Trading
Swing trading usually consists of holding a position for more than a day and often a few days, weeks or even months while the trading position matures. Investopedia has a great definition: Swing Trading Definition (investopedia.com).
Looking for shorter-term directional trades is often harder than long-term investing which focuses on the underlying business’s fundamentals. Seasonality and seasonal trading can often provide solid reasoning and logic as well as narrow the symbol universe for traders looking to enter profitable swing trades.
Swing traders often lean on seasonality as a primary factor in their trading and market timing due to the statistical nature and grounded logic behind the seasonal data. Adding seasonality along with other swing trading techniques like charts, price action, technical indicators can enhance the trader’s outlook.
Seasonal Trading vs. Chart Patterns
Chart patterns are arguably the most popular technical analysis technique many day and swing traders utilize. Most of the patterns, such as Head and Shoulders, Cup and Handle, Ascending Triangles, Bull Flags, Bear Pennants, Rising Wedges and more, are all defined and discussed at this great site: Chart Patterns, commodity and stock chart patterns, charting, technical analysis, commodity and stock price chart analysis, stocks, futures and options trading
However, many traders have a hard time quantifying chart patterns. Many questions arise such as what is the y-axis scale linear or log? Does changing the scale change the pattern? Are there defined terms for what constitutes a support or resistance line in the pattern, etc. Much of chart pattern trading is done through discretionary and manual process.
Seasonal trading is hard numbers, quantified with historical data. The combination of chart pattern trading with seasonal effects can find incredible winners.
Using Seasonality for Day Trading
Day trading is entering and exiting a trading position within the same trading day. Wikipedia has excellent info on day trading Day trading – Wikipedia. But can seasonality help day traders time the market better? The SeasonalTrading.com application allows traders to view intraday seasonality as well as daily. Intraday seasonality shows what time of the day and day of the week each stock (or any other asset) perform best, historically speaking. For instance, AAPL may perform best from 10:00 to 10:45 where MSFT may perform best from 14:00 to 14:30. This type of intraday timing knowledge combined with other day trading techniques can make a large impact to staying on the right side of the market. To learn more about intraday seasonality and using seasonality for day trading please check out this dedicated post: Day Trading with Seasonality
What is the best Swing Trading Strategy?
Most swing traders use various techniques such as price action, candlesticks, chart patterns, technical indicators and more to help time their swing trades lasting from a few days to even a few months. There is no consensus best swing trading strategy as all strategies work better during different market conditions. However, combining techniques often gives a boost to any swing trading strategy.
Seasonal trading has never meant to displace other successful trading methodologies but only to assist and augment. Seasonal trading can of course be a stand along swing trading strategy but often the best performance comes from combining multiple strategies into agreement before making swing trading strategy decisions.
What is the best Day Trading Strategy?
Similar to swing trading, day trading often analyzes various factors ranging from opening range, volume analysis, order flow, level II tape reading, market timing and more. However, there is no consensus best day trading strategy. Many techniques work on certain symbols or during certain times of the day but fail to perform on other symbols or during alternate times of the day.
SeasonalTrading.com’s intraday seasonal tool and newsletter provide data-driven insights into what are the best times of day and day’s of the week for entry and exit. Day trading data changes very quickly and nothing in the market is predictive of future returns; however, tracking what has happened can give a sense of how the trading algorithms and market making bots have been moving stocks lately. These historical entry and exit times can help contribute to an existing day trading strategy to help improve the results. Try our free trial to investigate the intraday seasonality tool and newsletter here: Pricing – Seasonal Trading