SPY Seasonality
Analysis for February 2026
This page shows SPY seasonality for February 2026, including a calendar view of historical seasonal windows and monthly patterns. Seasonality is a historical tendency – not a prediction – and should be combined with risk controls and your own filters.
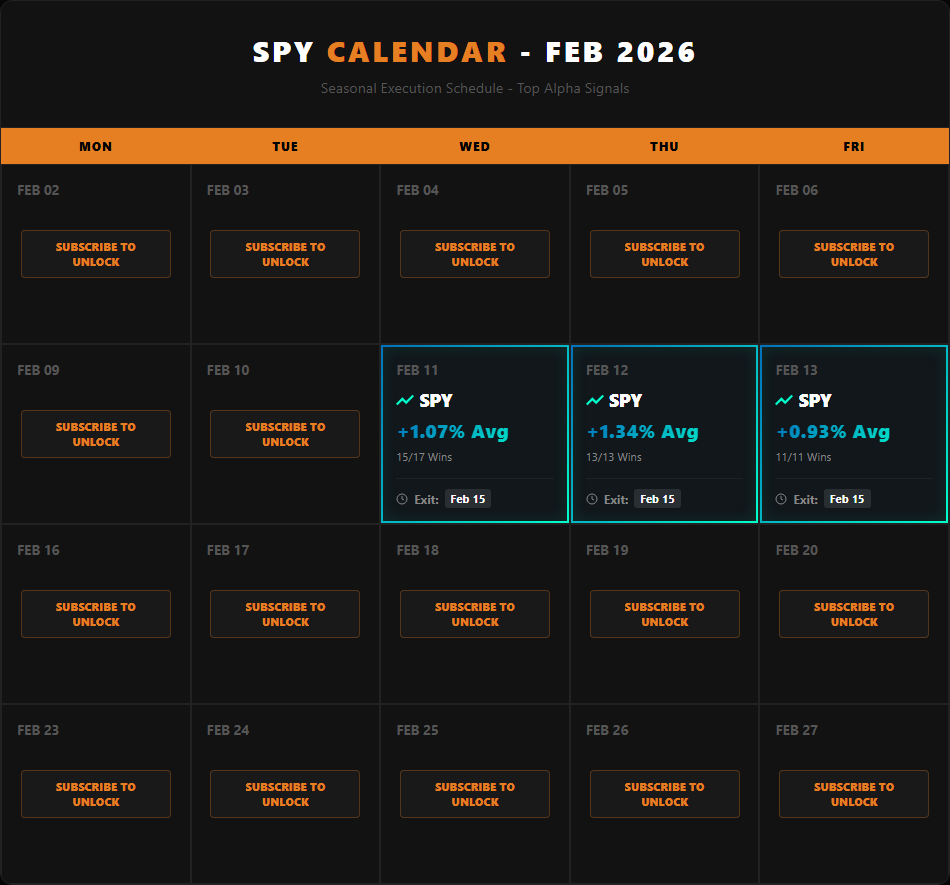
SPY Top Trades for February 2026
To see other months or symbols start your free 7-day trial today
Best short-term trade for SPY this month
* We define a short-term trade as having a holding period of 3 days or less.
Best long-term swing trade for SPY this month
* We define a long-term swing as any trade with a holding period of 4 or more days.
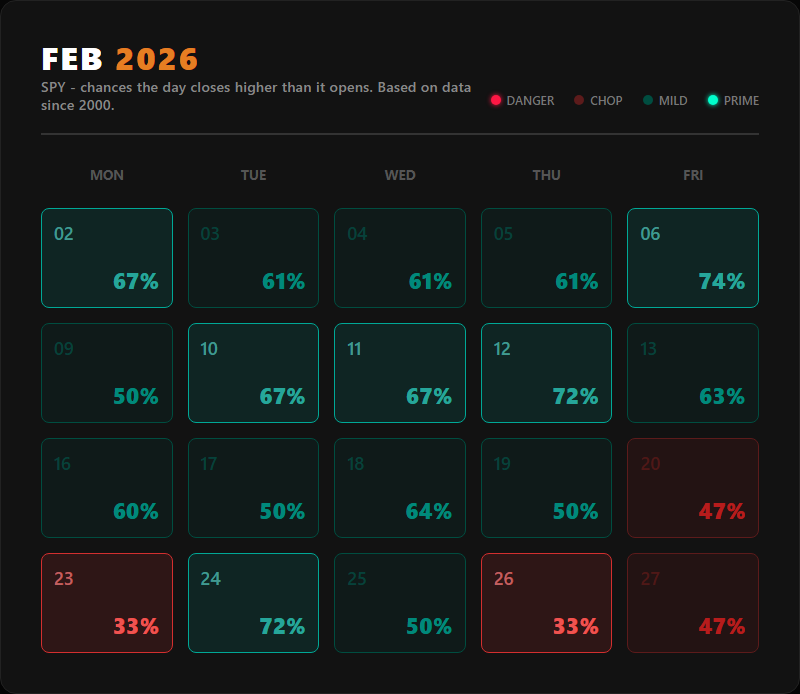
Historically stronger days for SPY in February
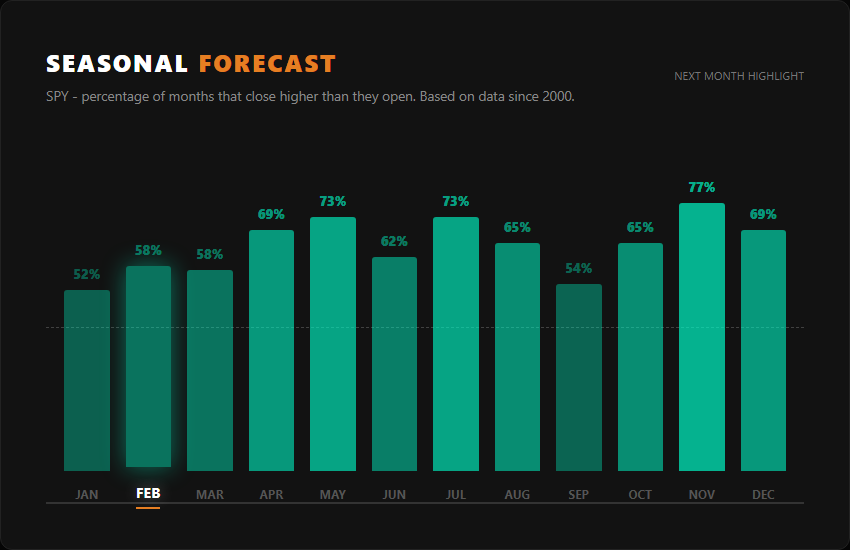
SPY chances of closing the month higher
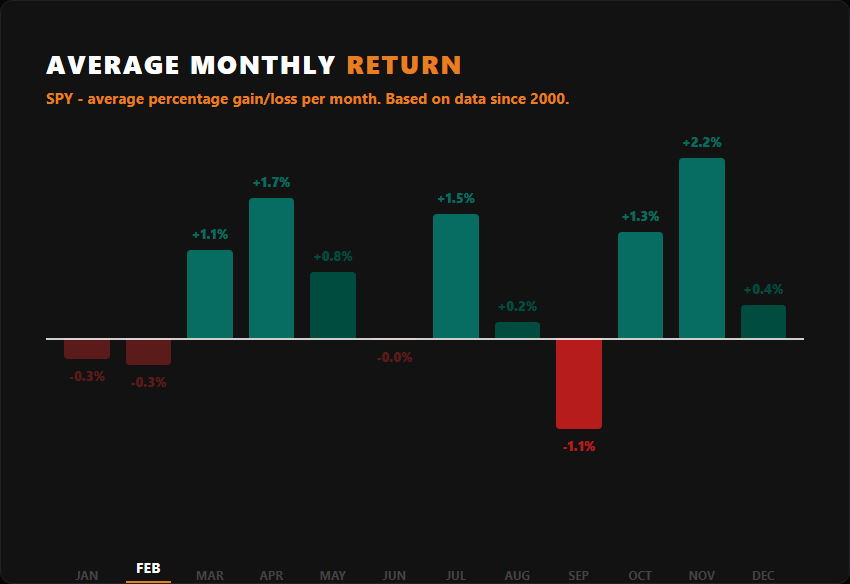
SPY average return by month
How traders use seasonality for SPY
As a timing lens, not a standalone signal
Seasonality highlights dates when SPY has historically shown consistent strength or weakness. Traders often combine it with a simple trend or volatility filter to avoid fighting the tape.
To plan entries/exits in advance
Instead of reacting to headlines, traders use known seasonal windows to pre-plan risk, size smaller when conditions are noisy, and focus attention only when a window is active.
To build a watchlist efficiently
Seasonality can narrow “what to watch” to a short list for February, then technicals/fundamentals decide “whether to act.”
For ETFs like SPY, traders often use seasonality alongside broad market regime filters (risk-on/risk-off).
Risk notes (please read)
- Seasonality is descriptive, not predictive. These are historical tendencies based on past price behavior – there is no guarantee they repeat.
- Outliers happen. Even strong historical windows can fail due to news, macro shocks, earnings, or regime changes.
- Backtests can mislead. Small sample sizes and changing market structure can inflate historical results.
- Use risk controls. Consider position sizing, stop logic, and diversification.
- Educational content only. This page is for informational purposes and is not financial advice.
Want the full SPY calendar?
Start a free trial to unlock the full calendar (unblurred), daily email cheatsheets, and our full “Best Trades” list.
Start Free Trial